Census data · 1900–2020

Niagara Falls by the Decade

The Power City's whole arc in two charts: who lived in Niagara Falls, and where its immigrants came from. A city that quintupled in sixty years, then lost more than half of itself. Hover any decade for the story behind the numbers.

I. Who Lived Here

The city's population by race, census by census, 1900 to 2020. The top edge of the stack traces the whole story: the electrochemical boom, the 1960 peak of 102,394, and a fall steeper than almost any American city its size.

Partly reconstructed. Figures for 2000–2020 follow the decennial censuses; earlier decades are reconstructed from census records and rounded. The shape is the story, not the last digit.
Hover or tap a decade to read what happened and why
White Black Native American Asian, other & two or more races
Niagara Falls' total population peaked at 102,394 in 1960, then fell by more than half to 48,671 in 2020. The white population fell from roughly 96,000 in 1960 to about 30,000 in 2020, while the Black population grew from about 5,600 to about 12,000.

II. Where They Came From

Niagara Falls was a border boomtown: its immigrants walked across a bridge from Canada, or crossed an ocean to dig tunnels and tend furnaces. This chart is an approximate reconstruction of the city's foreign-born residents by country of birth, 1900 to 1970, from the construction of the great power tunnels to the last years of Little Italy's immigrant generation.

A historical reconstruction. Figures are approximate and rounded; the shape is the story, not the last digit. Details in the notes below.
Italy Canada Poland Germany England & Scotland All other countries
Niagara Falls' foreign-born population peaked around 17,000 in 1930 and fell below 6,000 by 1970. Canadians were the largest group in 1900; Italians became the largest by the 1920s and remained so for the rest of the era.

III. The Evidence

Seven plates from the public archives, spanning the whole arc of the charts above: the freedom line, the temple of power, the boom, the monument, and what was left behind.

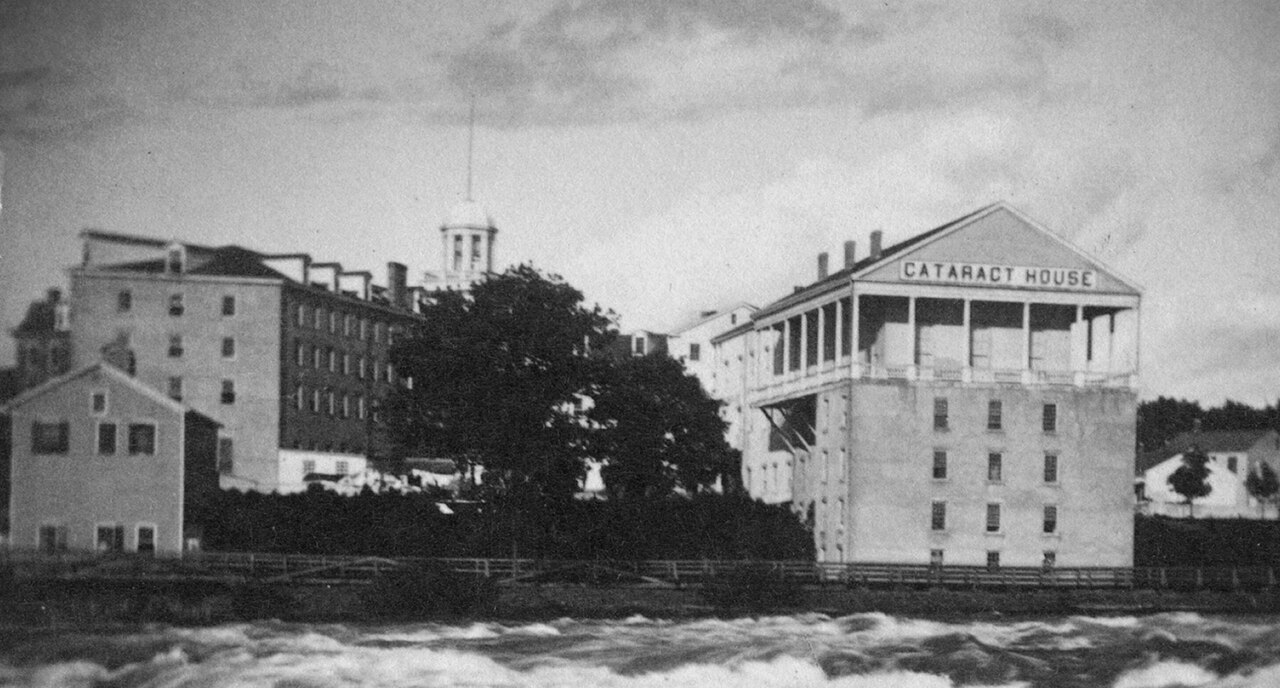
The Cataract House hotel beside the rapids, circa 1860
Plate I · c. 1860The Cataract House, the grand hotel above the rapids. Its famed Black waiters, many of them formerly enslaved, ferried freedom seekers across the river to Canada by night — the last station on the line.
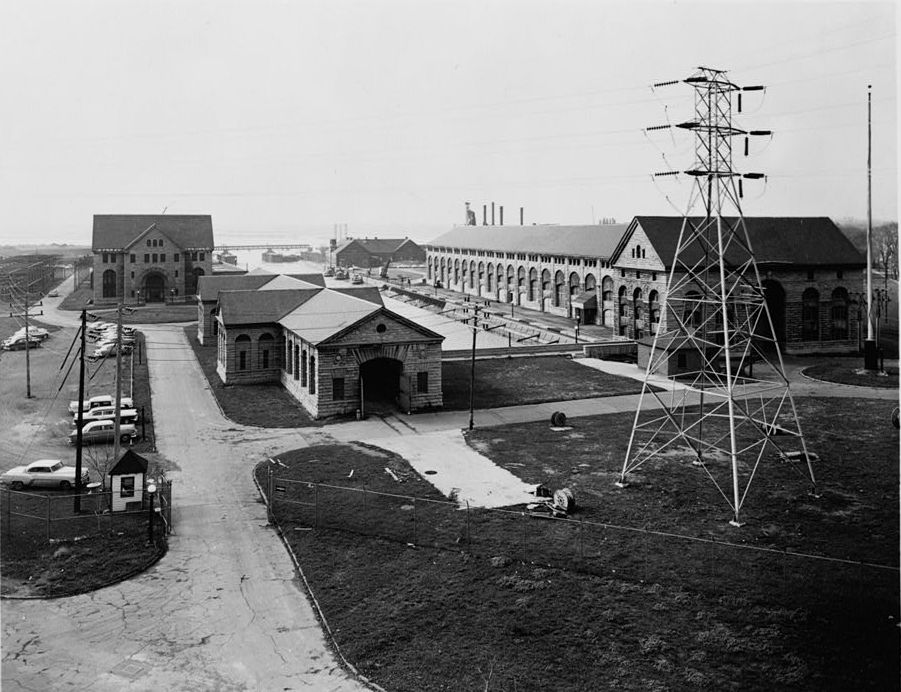
Edward Dean Adams Power Plant exterior, Historic American Buildings Survey photograph
Plate II · 1895The Edward Dean Adams Power Plant, where Tesla and Westinghouse's alternating current won the war of currents and made the Power City possible. Photographed for the Historic American Buildings Survey.
Construction of the Niagara power canal works, circa 1901
Plate III · c. 1901Harnessing the river: the canal and wheelpit excavations that turned scenery into horsepower. Work like this — pick, shovel, and dynamite — is what filled the immigrant wards of Chart II.
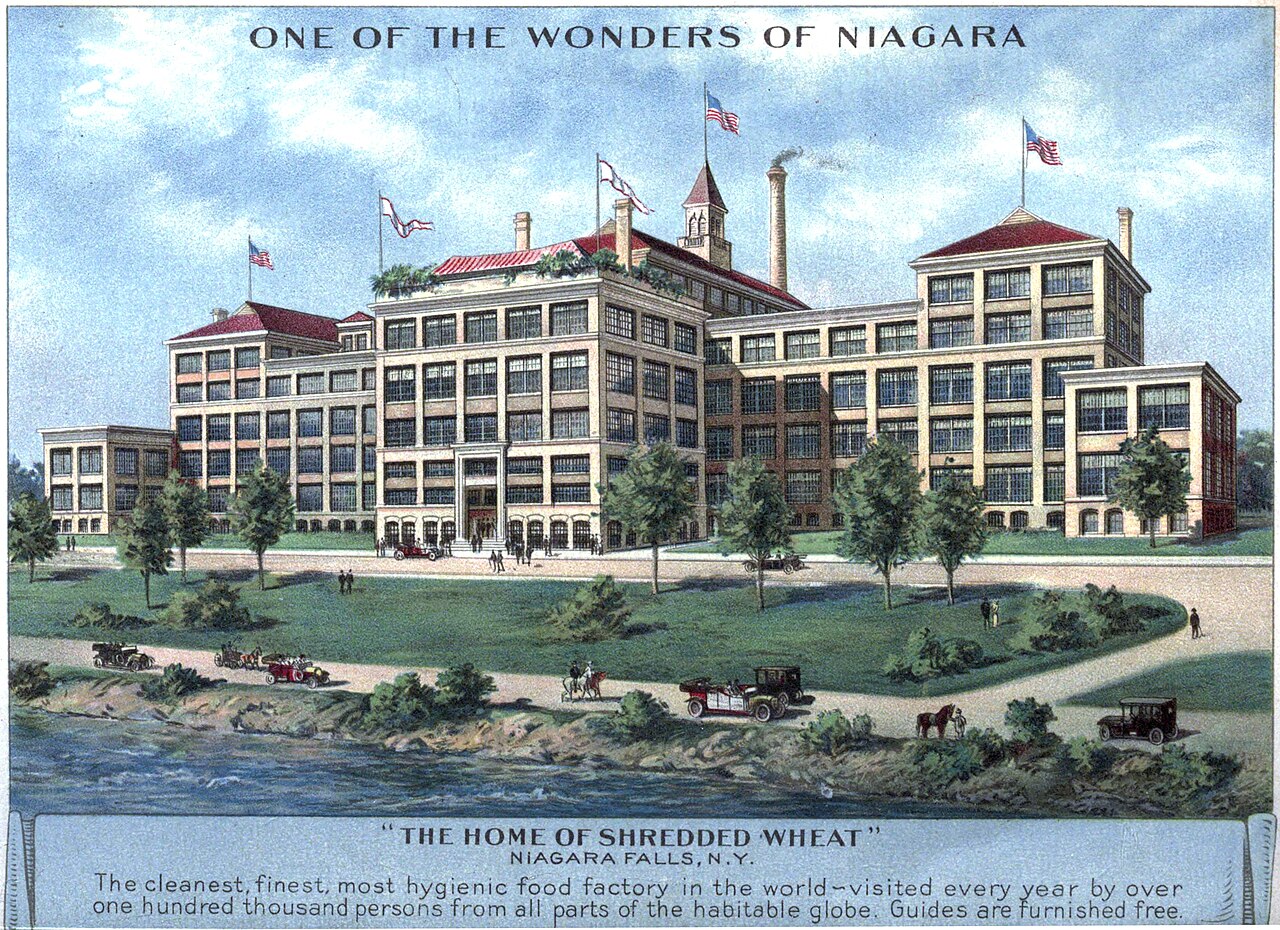
The Shredded Wheat factory, Niagara Falls, 1914 postcard
Plate IV · 1914"The Home of Shredded Wheat": the gleaming model factory that fed tourists and workers alike, in the era when the city sold itself as the showroom of electrified industry.
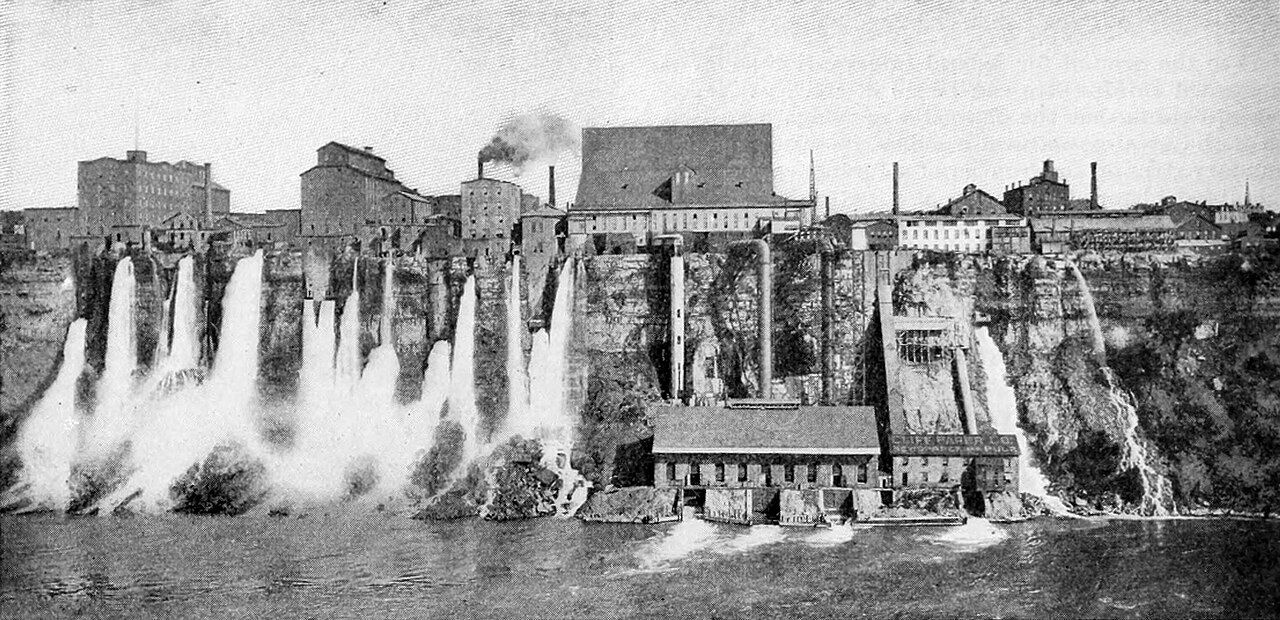
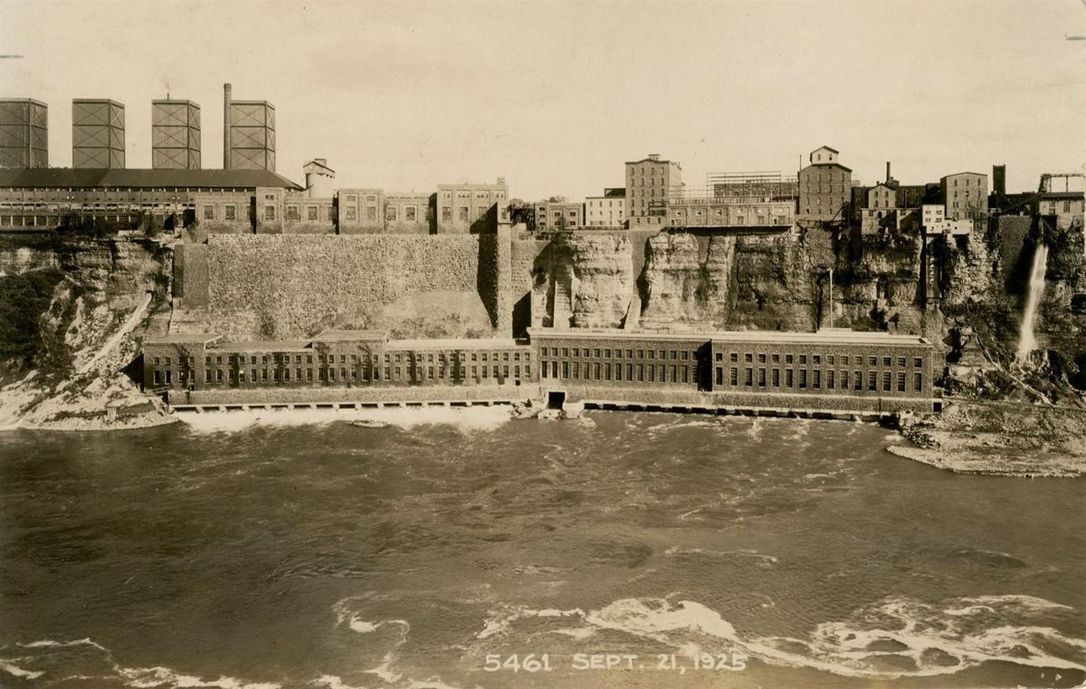
Power stations in the Niagara Gorge, 1925
Plate V · 1925The gorge powerhouses at full strength. Thirty-one years later, the rock face behind Schoellkopf Station collapsed into the river — the disaster that summoned Robert Moses and the biggest decade the city ever had.
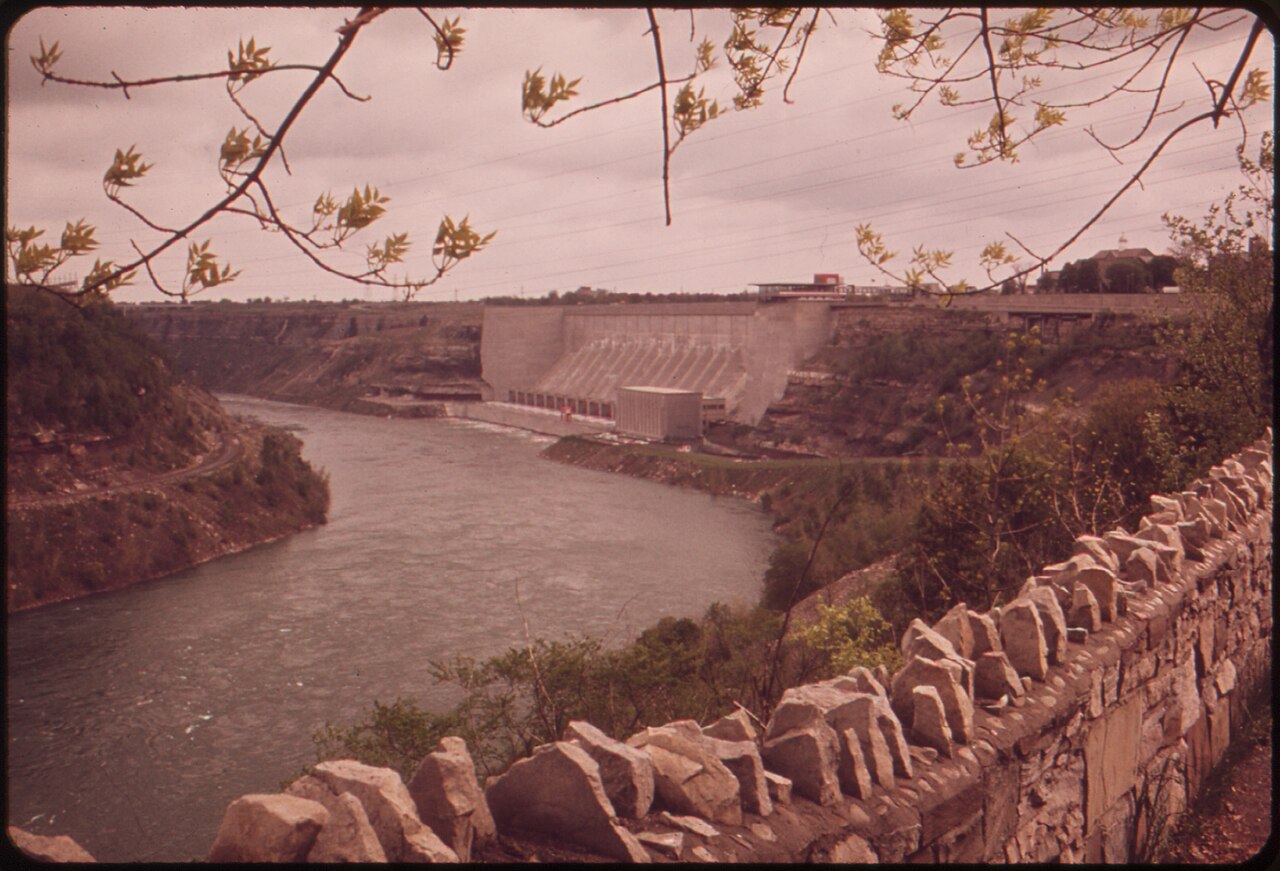
Robert Moses Niagara Power Plant, 1973, EPA Documerica photograph
Plate VI · 1973The Robert Moses Power Plant, monument of the 1960 peak — built in part on Tuscarora land taken over the nation's objections. Photographed for the EPA's Documerica project as the city's fall was beginning.
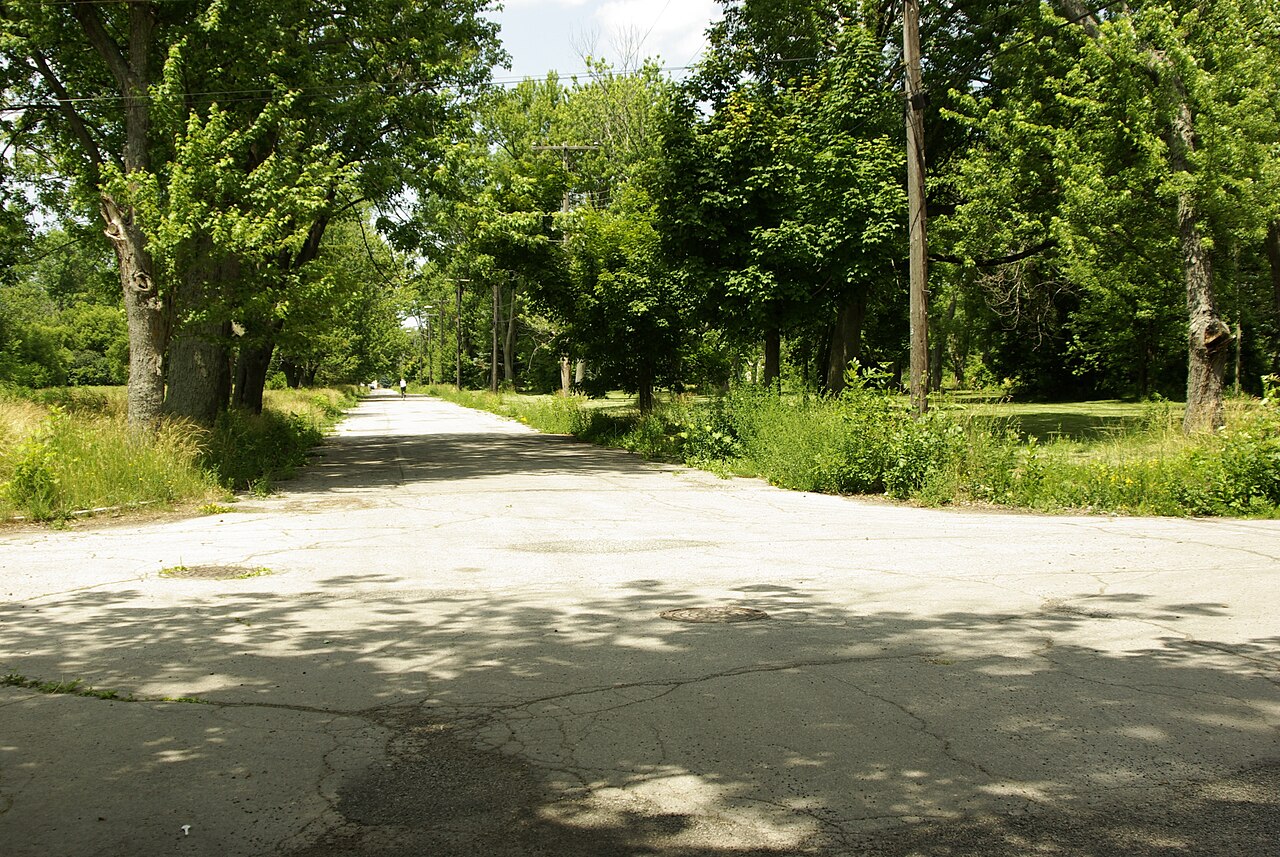
Abandoned overgrown streets of the Love Canal neighborhood
Plate VII · AfterThe streets of Love Canal, still empty decades after the 1978 emergency. Curbs and streetlights with no houses: the ruin that gave America its Superfund law.
Notes on the data & how to read these charts

About the race categories

Chart I uses race-alone counts that sum to the city total. 2000–2020 follow the decennial censuses (2020: 61.1% white, 24.6% Black, 1.8% Native American, 2.1% Asian); earlier decades are reconstructed from census records for a city that was too small for the Census Bureau's big-city historical tables. Hispanic origin crosses all races and is not a separate band; the city was about 5% Hispanic in 2020. Multiracial responses were first allowed in 2000, which widens the purple band from that point on.

The Tuscarora, on and off the map

The Tuscarora Nation's reservation sits just beyond the city line, so its residents are not in these city counts — but Tuscarora and other Haudenosaunee people have always lived and worked in the city itself, and the green band traces that in-city population. The nation's fight against the Power Authority's reservoir, lost at the Supreme Court in 1960, is part of the same story the peak decade tells.

About the photographs

All plates are from open archives via Wikimedia Commons: the Cataract House and Shredded Wheat views are pre-1929 public domain; the Adams Plant is a Historic American Buildings Survey photograph (Library of Congress); the 1901 excavation view is an Internet Archive book scan; the 1925 gorge view is public domain; the Robert Moses Plant is from the EPA's Documerica project (National Archives); the Love Canal streetscape is a CC0 photograph. Images are served from this site, not hotlinked.

Foreign-born, not ancestry

Chart II counts people born abroad, not ethnic communities. Italian Niagara Falls was always several times larger than its Italian-born band: by 1930, second-generation Italian Americans far outnumbered their immigrant parents along Pine Avenue. "All other countries" includes one of America's older Armenian communities, plus Syrians, Hungarians, Ukrainians, and more. Canadian-born figures blur a border that thousands crossed daily for work in both directions. Values are rounded to the nearest 500 and shown with a tilde; the trends and rankings are well documented even where tabulations disagree at the margins.